
/ Slicktify
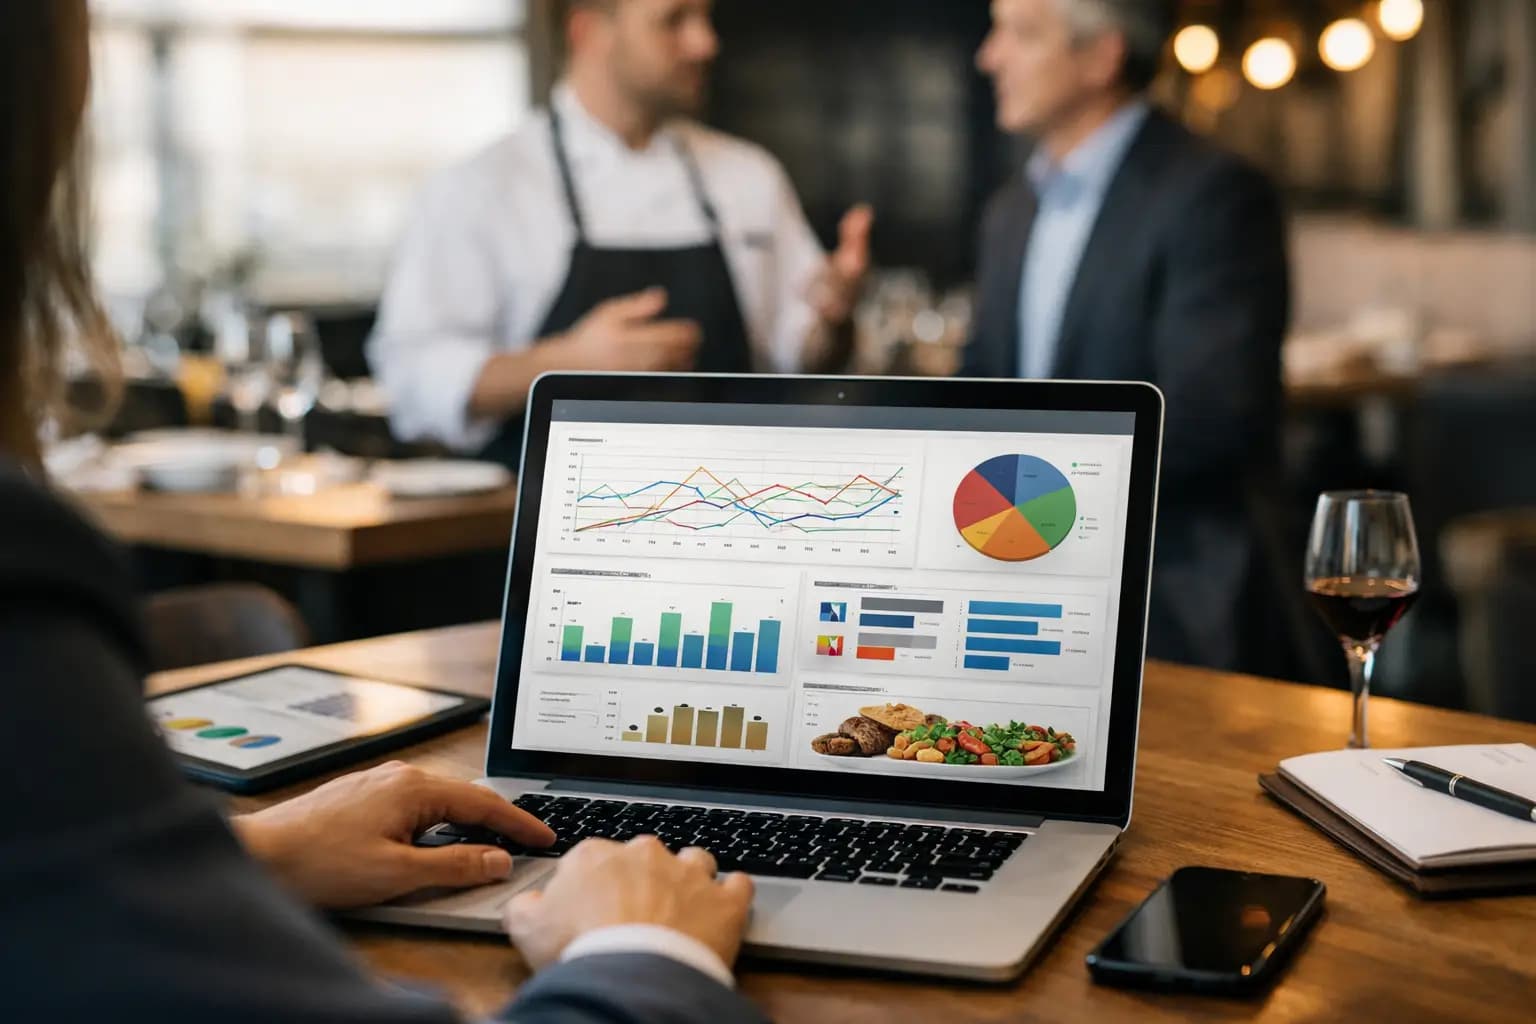
A restaurant group operations dashboard should answer the questions operators are already chasing across calls, spreadsheets, texts, and disconnected systems: Which locations are off plan? What needs attention now? Who owns the next action? If leadership has to wait until the weekly meeting to find out that labor is drifting, a walk-in cooler is failing, or a manager has not closed a critical task, the operating model is already too slow.
For a multi-location restaurant business, the challenge is not a lack of data. It is that the data lives in too many places and arrives without context. Sales may be visible in one system, labor in another, facilities requests in email, and lease or property obligations in a shared drive. A useful dashboard creates a command center around the work that crosses all of them.
What a Restaurant Group Operations Dashboard Must Do
A dashboard is not a wall of charts. It is a decision tool. Its job is to make exceptions visible, establish accountability, and help operators move from a portfolio-level signal to a location-level action without compiling a report by hand.
That distinction matters. A regional operator does not need another screen showing total weekly sales if they cannot immediately see which restaurant is missing its target, whether the issue is traffic, labor pressure, downtime, staffing, or an unresolved operational problem. Executives need the portfolio view, but field teams need enough detail to act before a small issue becomes a missed month.
The strongest dashboards combine performance measures with operating conditions. Revenue and labor are essential, but they only tell part of the story. A location can hit sales while accumulating overdue repairs, recurring equipment issues, incomplete compliance tasks, or rising occupancy costs. Those are not separate administrative concerns. They are operating risks with financial consequences.
Start with the decisions, not the data sources
Before choosing metrics, define the decisions each role must make. A chief operating officer may need to identify locations requiring intervention. A regional manager needs a prioritized queue of unresolved exceptions. A facilities lead needs to see open work orders, aging requests, and repeat failures by site. A finance leader may need a concise view of revenue performance, rent obligations, and material cost variances.
When every metric has a clear owner and a practical use, the dashboard stays focused. When teams begin by importing every available field, the result is usually clutter. More visibility is not automatically better visibility. The right amount depends on the number of locations, the operating model, and whether restaurant real estate and facilities are managed internally or through outside partners.
The Operating Views That Matter Most
A restaurant group operations dashboard should organize information around a few connected views rather than force users to assemble their own story from dozens of reports.
Portfolio health
The top-level view should show the condition of the restaurant portfolio at a glance. This is where leaders can compare actual performance to plan, scan for locations outside acceptable thresholds, and see the concentration of open operational issues. It should make underperformance obvious without implying that every variance needs the same response.
Useful signals often include sales versus target, labor percentage, open and overdue work orders, task completion, high-priority alerts, occupancy or lease milestones, and sites with recurring exceptions. Trend direction is as valuable as the current number. A restaurant that is slightly below target for one day may not require escalation. A restaurant that has slipped for four consecutive weeks while maintenance requests age deserves attention.
Location performance and accountability
Once a portfolio issue is identified, operators need to move quickly into the individual location. The location view should bring together the operational record: current performance, assigned tasks, maintenance activity, incidents, documents, key contacts, and upcoming obligations.
This is where a dashboard becomes more than reporting. Instead of sending messages asking for status, a regional leader can see what was assigned, who owns it, whether it is overdue, and what evidence or update has been recorded. That creates a cleaner operating cadence. Managers spend less time defending a status update and more time resolving the underlying issue.
Facilities, assets, and maintenance risk
Restaurant operations are unusually exposed to asset failure. A malfunctioning refrigeration unit, HVAC problem, hood-system issue, or point-of-sale outage can affect product quality, employee conditions, guest experience, and revenue in the same day. Yet maintenance is often managed separately from the performance conversation.
A centralized view should show open work orders by priority and age, repeat issues by equipment or property, vendor activity, and unresolved alerts. If asset records, service history, and documents sit in the same operating layer, teams can see whether a location is dealing with an isolated repair or a pattern that calls for replacement planning.
There is a trade-off here. A group with a small number of restaurants may not need highly granular asset analytics on the executive home screen. Larger groups with diverse sites, aging equipment, or landlord-managed responsibilities often do. The principle is simple: surface the risks that affect operational continuity, then keep the deeper details available when needed.
Property and occupancy obligations
For restaurant groups, the restaurant is also a property commitment. Rent escalations, renewal windows, insurance requirements, landlord notices, inspections, and site-level documents can create expensive surprises when they are tracked in inboxes or personal calendars.
An effective dashboard connects operational performance to property oversight. Leaders can see not only whether a location is producing, but also whether it has upcoming lease events, unresolved landlord items, or occupancy costs that need review. This is especially useful for groups managing a mix of owned, leased, franchised, or nontraditional locations.
Build for Exceptions, Not Constant Monitoring
No operations team can watch every location every hour. The dashboard should reduce attention demands by emphasizing exceptions: conditions outside an agreed range, tasks past due, alerts without an owner, or recurring issues that have not been resolved.
Thresholds should reflect the business rather than generic benchmarks. A fast-casual group, a full-service concept, and an airport unit will not share the same labor pattern or sales cadence. Even within one brand, seasonality, hours, local events, and market maturity change what normal looks like. Use standardized rules where consistency matters, then allow enough context for operators to judge the signal correctly.
Alerts also need discipline. If every minor variance triggers a notification, teams learn to ignore the system. Assign severity levels, require owners for significant exceptions, and establish escalation rules for issues that remain unresolved. The goal is not more alerts. It is faster action on the issues that materially affect the business.
Create a Shared Operating Rhythm
Technology alone does not create accountability. The dashboard needs to fit into how the group runs its week.
At the executive level, it can support a portfolio review centered on top exceptions, emerging risks, and decisions requiring leadership support. Regional meetings can focus on locations that are off plan, overdue commitments, and corrective actions with named owners. At the store level, managers can use the same system of record to close tasks, report issues, and maintain visibility into what is due next.
This shared rhythm changes the quality of conversations. A review becomes less about reconstructing what happened and more about deciding what will happen next. It also preserves institutional knowledge when managers, vendors, or regional leaders change. The record stays with the location rather than disappearing into someone's inbox.
Avoid the Common Dashboard Failure Modes
The most common failure is treating a dashboard as a reporting project rather than an operating system. Teams spend months defining measures but never connect them to ownership, workflow, or escalation. The numbers look polished, yet nobody knows who is expected to respond.
Another failure is relying on manual updates for critical information. Spreadsheets can be useful for analysis, but they are a weak system of record for recurring operational work. Versions multiply, deadlines get buried, and the person who understands the file becomes a bottleneck.
Finally, avoid separating financial performance from operational readiness. A revenue report cannot explain a site closure risk. A maintenance log cannot show the performance impact of recurring downtime. A centralized platform such as Slicktify gives restaurant leaders one structured view across assets, properties, work, alerts, and portfolio-level intelligence, so those connections are easier to see and manage.
A good restaurant group operations dashboard does not ask leaders to become full-time analysts. It gives them a disciplined way to see what matters, assign the next move, and keep every location operating from the same playbook.